EMA (Exponential Moving Average) and Stochastic represent widely used technical indicators within the realm of trading and investing. EMA, categorized as a variant of moving average, assigns greater significance to recent price data, resulting in a smoother trend line that swiftly adapts to market fluctuations. This feature proves invaluable for recognizing short-term trends and potential points of entry or exit.
Conversely, Stochastic evaluates a security's closing price in relation to its price range over a predetermined timeframe. This tool aids in identifying potential overbought or oversold conditions, thus assisting traders in foreseeing potential reversals or corrections in price trends.
When employed in tandem, EMA and Stochastic yield a comprehensive understanding of an asset's momentum and possible inflection points. While EMA underscores the overall direction, Stochastic provides insights into the current strength.
We will explore this integrated approach using EMA and Stochastic for both scalping trading and vfxAlert online trading signals.
Video: https://www.youtube.com/watch?v=fFlikotR2YU
Strategy Characteristics:
Timeframe: 30 seconds - M1
Trading Asset: Any currency pair demonstrating moderate to high intraday volatility
Trading Time: All trading sessions
Expiration: Not fewer than 3-5 candles within the designated timeframe
Chart Setup:
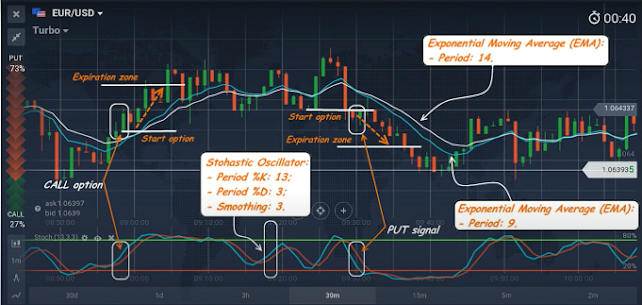
EMA 1 - Period = 14; EMA 2 - Period = 9
Stochastic:
Period %K = 13;
Period %D = 3;
Smoothing = 3.
Trading Signals:
CALL Option: When Stochastic rises above level 20 and trends upward, with the current candle closing above the moving averages.
PUT Option: Conversely, when Stochastic falls below level 80 and the candle concludes below the midpoint.
The optimal timing for opening an option occurs when the initial candle concludes above or below the moving averages, thereby causing a notable shift in the Stochastic indicator. Monitoring the Stochastic indicator is crucial, ensuring it departs from either the overbought zone (80) or the oversold zone (20). Should the initial signal on the M1 chart be missed, considering an entry based on the second candle is acceptable. Nonetheless, exercising patience and awaiting subsequent signals is recommended for a more advantageous opportunity.


Comments
Post a Comment